NextGen RiderNextGen Rider helps motorcyclists make smarter tech decisions by comparing and reviewing the latest smart displays, dashcams, and connected riding systems — all in one place nextgenrider.com
Category Archives: Twisties
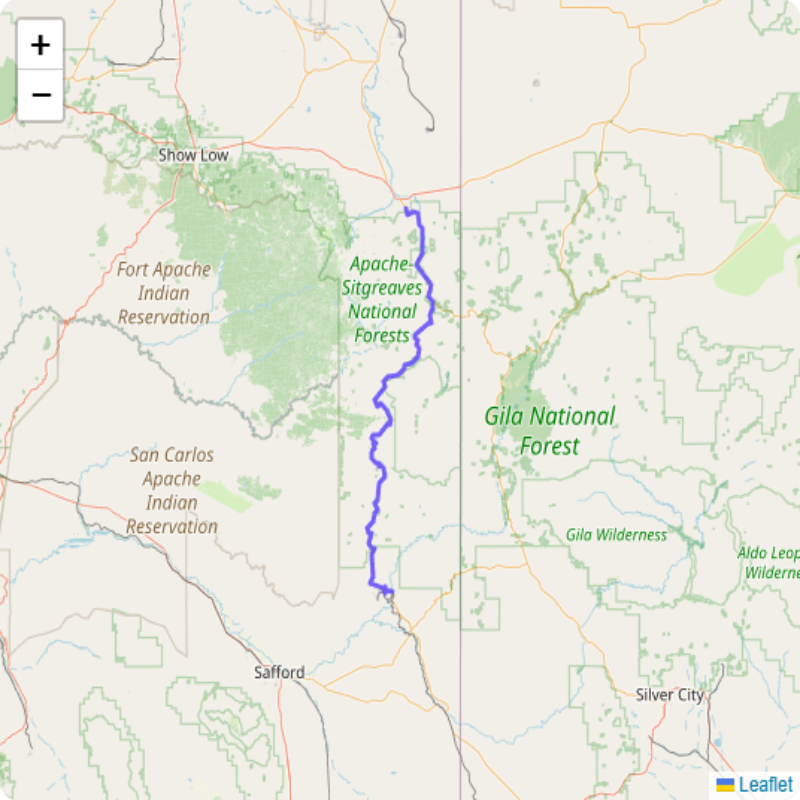
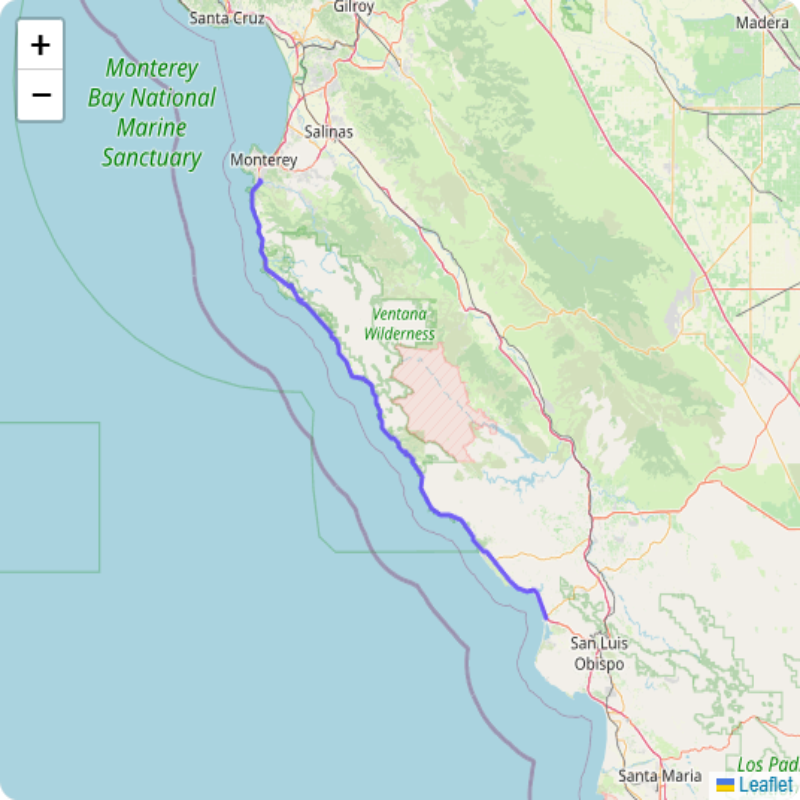
GPX Analysis: Coronado Trail Detailed analysis of the Coronado Trail route, including twistiness score, key metrics, and visual profiles. Twistiness Score 41 Key Metrics Metric Value Points 4937 Length 188.90 km Elevation Gain 5890 m Curve Density 18.1 curves/km Mean Curvature 37.08 deg/100m Elevation Density 31 m/km Sinuosity 1.61 Switchbacks 20 Turn Angle Density 150 […]
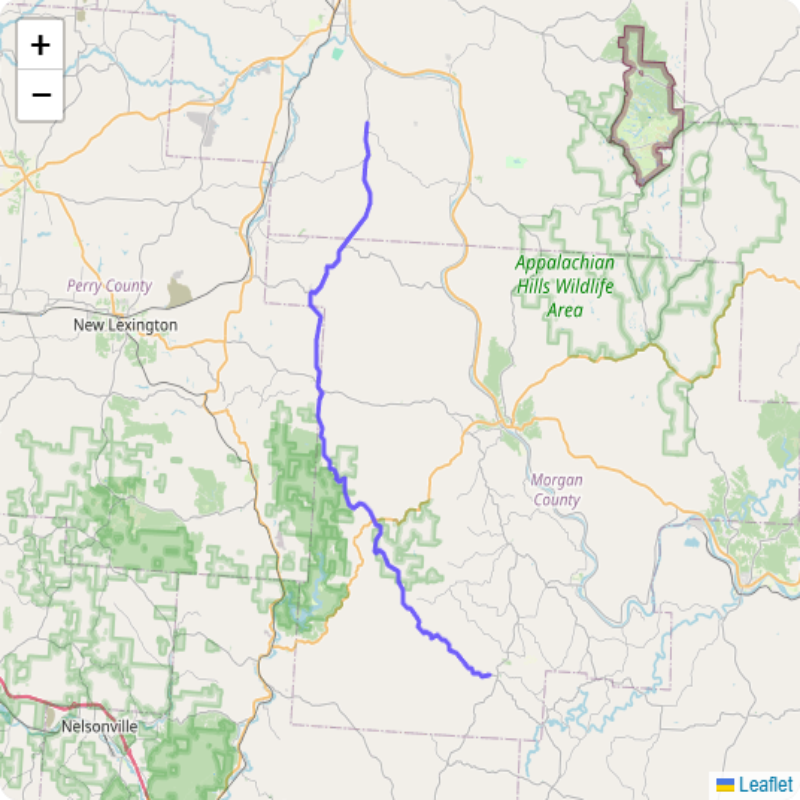
GPX Analysis: Triple Nickel Route 555 Detailed analysis of the Triple Nickel Route 555 route, including twistiness score, key metrics, and visual profiles. Twistiness Score 37 Key Metrics Metric Value Points 1492 Length 53.53 km Elevation Gain 936 m Curve Density 18.9 curves/km Mean Curvature 34.94 deg/100m Elevation Density 17 m/km Sinuosity 1.34 Switchbacks 0 […]
GPX Analysis: The Hellbender 28 Detailed analysis of the The Hellbender 28 route, including twistiness score, key metrics, and visual profiles. Twistiness Score 53 Key Metrics Metric Value Points 1441 Length 35.58 km Elevation Gain 1247 m Curve Density 31.8 curves/km Mean Curvature 41.31 deg/100m Elevation Density 35 m/km Sinuosity 1.52 Switchbacks 2 Turn Angle […]
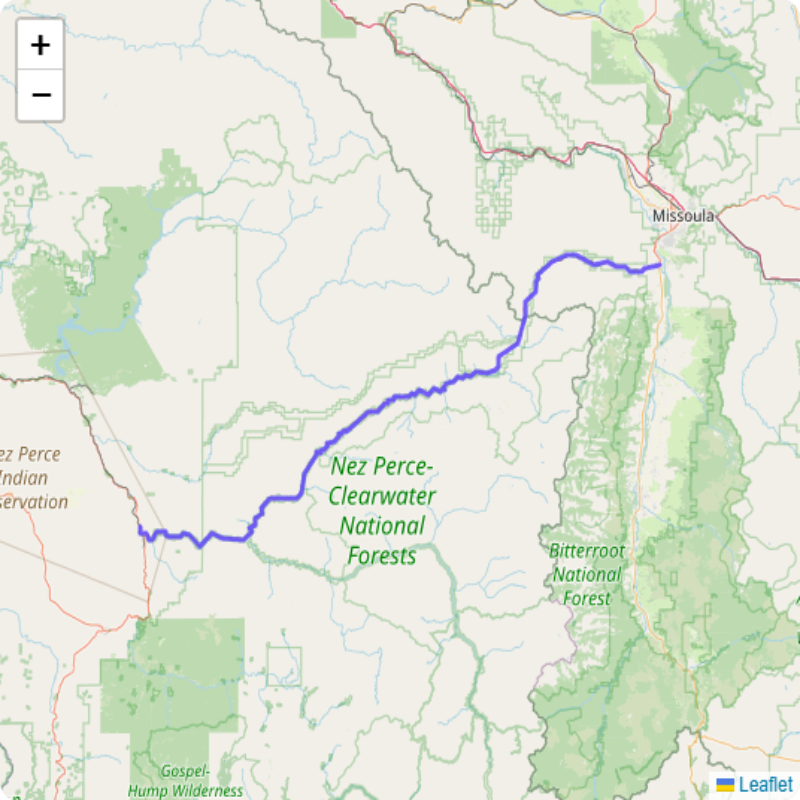
GPX Analysis: Lolo Pass Detailed analysis of the Lolo Pass route, including twistiness score, key metrics, and visual profiles. Twistiness Score 20 Key Metrics Metric Value Points 3872 Length 216.85 km Elevation Gain 4658 m Curve Density 10.2 curves/km Mean Curvature 13.71 deg/100m Elevation Density 21 m/km Sinuosity 1.35 Switchbacks 0 Turn Angle Density 82 […]
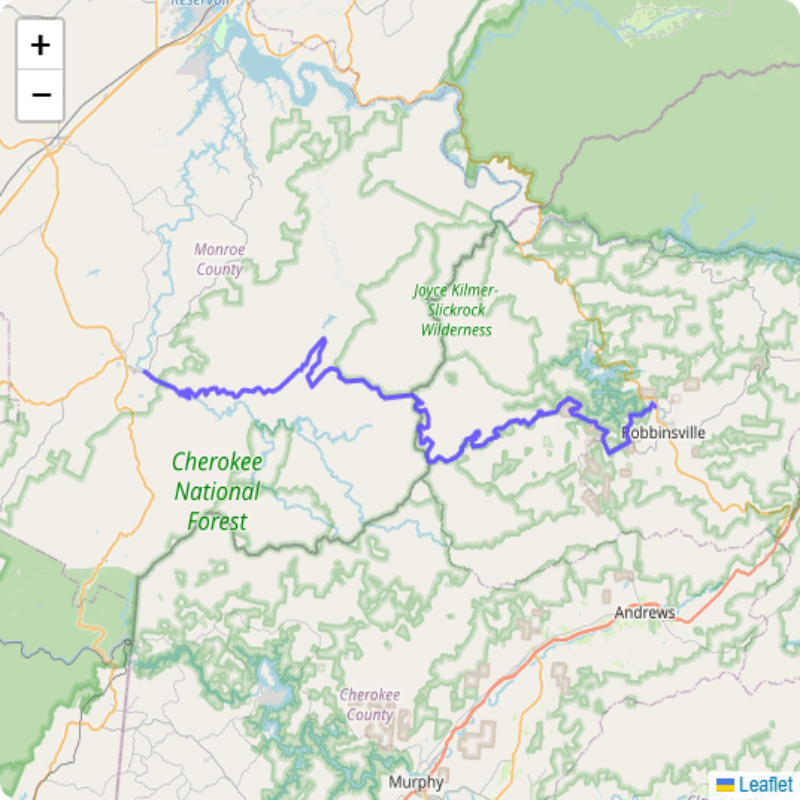
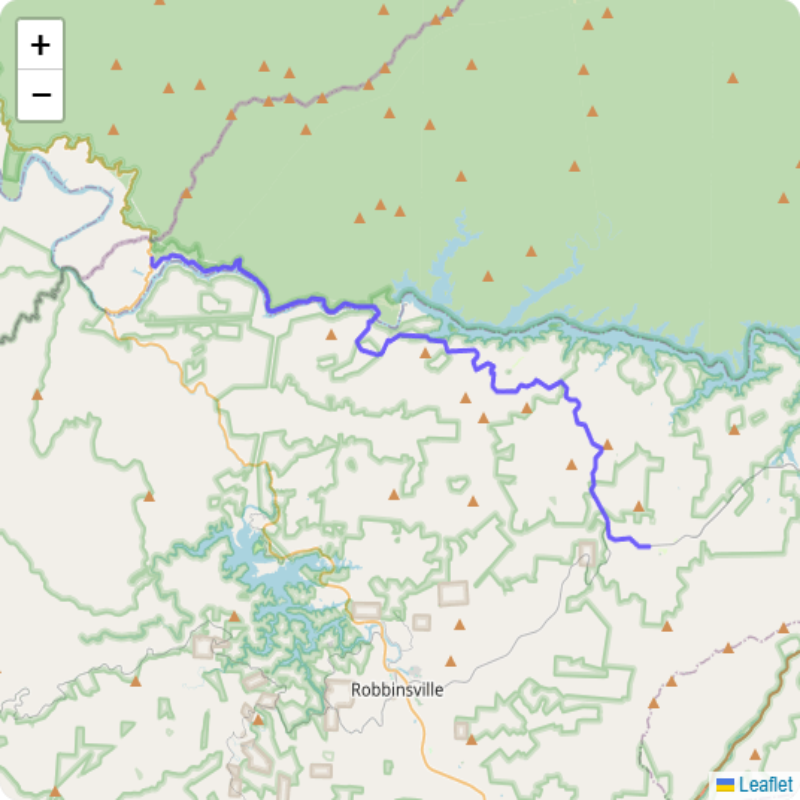
GPX Analysis: Cherohala Skyway Detailed analysis of the Cherohala Skyway route, including twistiness score, key metrics, and visual profiles. Twistiness Score 51 Key Metrics Metric Value Points 2876 Length 81.72 km Elevation Gain 2846 m Curve Density 28.0 curves/km Mean Curvature 34.87 deg/100m Elevation Density 35 m/km Sinuosity 1.91 Switchbacks 2 Turn Angle Density 201 […]
GPX Analysis: Twisted Sisters Loop Detailed analysis of the Twisted Sisters Loop route, including twistiness score, key metrics, and visual profiles. Twistiness Score 30 Key Metrics Metric Value Points 2087 Length 153.63 km Elevation Gain 1737 m Curve Density 6.9 curves/km Mean Curvature 18.08 deg/100m Elevation Density 11 m/km Sinuosity 4492.97 Switchbacks 3 Turn Angle […]
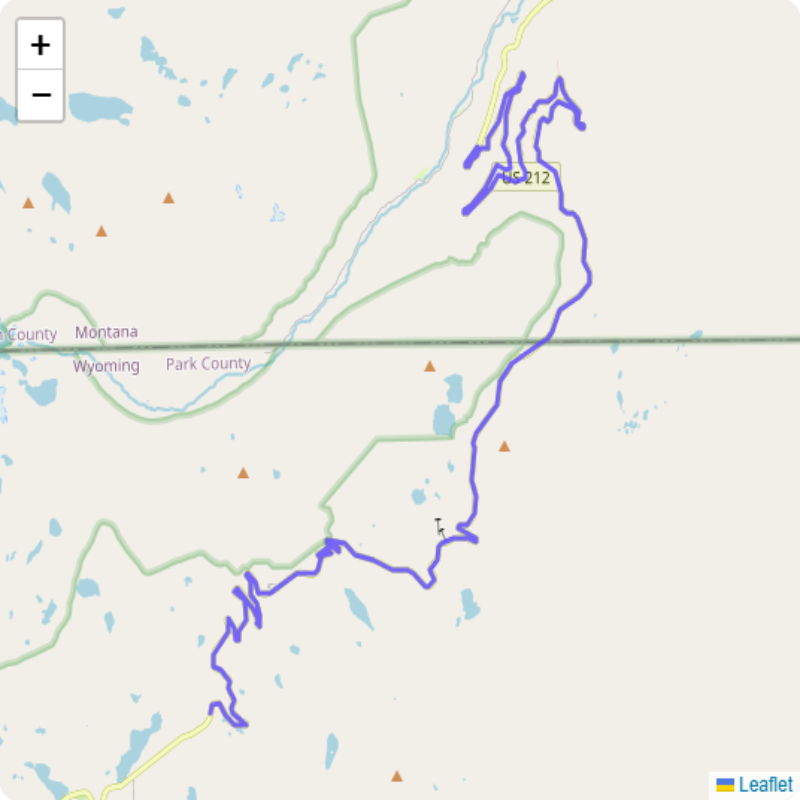
GPX Analysis: Beartooth Highway Detailed analysis of the Beartooth Highway route, including twistiness score, key metrics, and visual profiles. Twistiness Score 67 Key Metrics Metric Value Points 1154 Length 32.52 km Elevation Gain 815 m Curve Density 27.5 curves/km Mean Curvature 55.81 deg/100m Elevation Density 25 m/km Sinuosity 3.14 Switchbacks 26 Turn Angle Density 245 […]
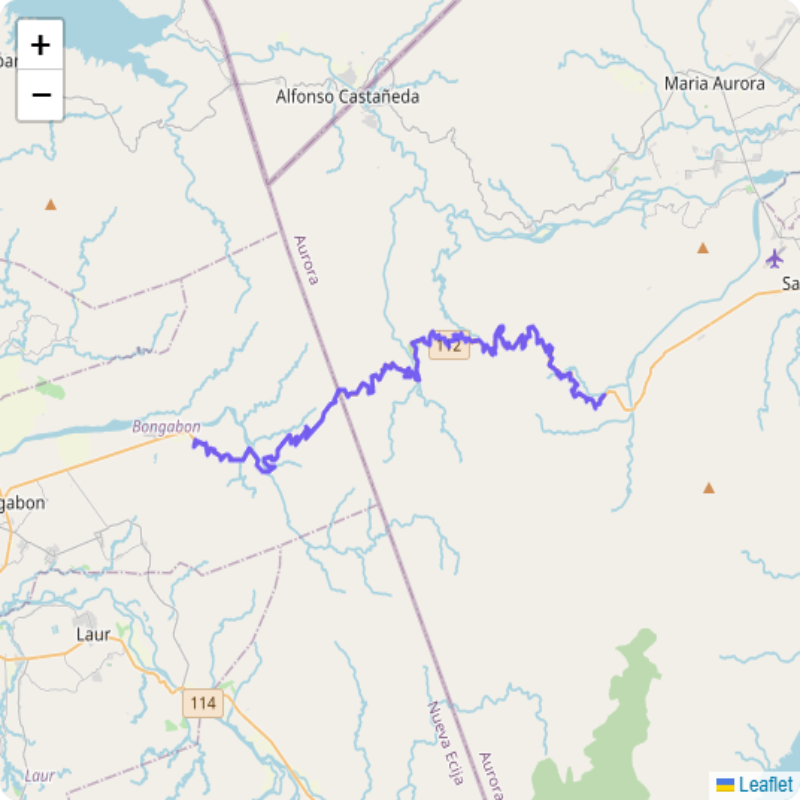
GPX Analysis: Nueva Ecija – Aurora Road Detailed analysis of the Nueva Ecija – Aurora Road route, including twistiness score, key metrics, and visual profiles. Twistiness Score 83 Key Metrics Metric Value Points 3432 Length 55.31 km Elevation Gain 3715 m Curve Density 55.7 curves/km Mean Curvature 114.07 deg/100m Elevation Density 67 m/km Sinuosity 2.73 […]
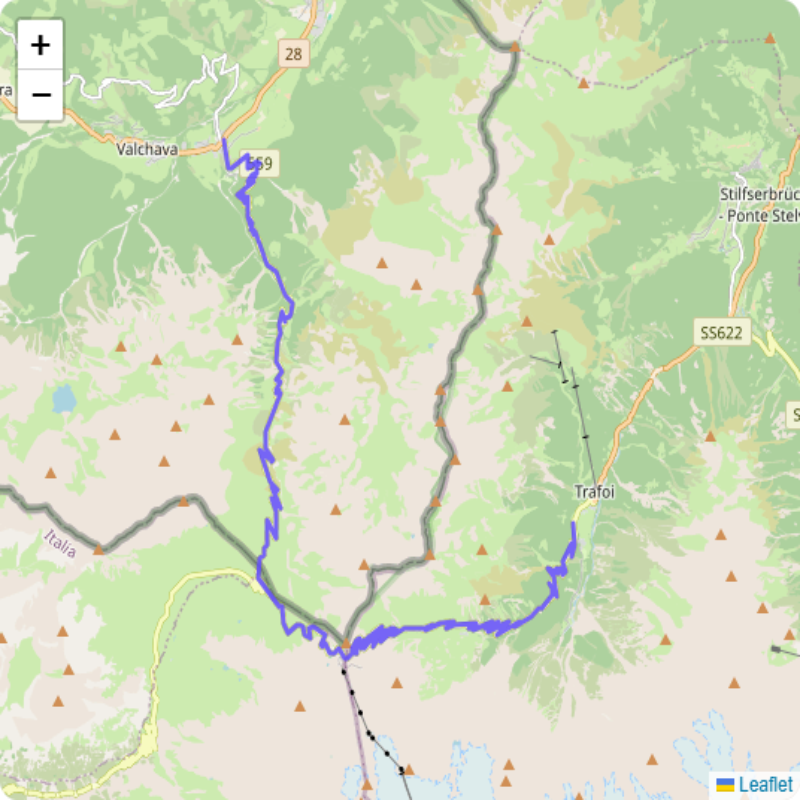
GPX Analysis: Stelvio Pass Detailed analysis of the Stelvio Pass route, including twistiness score, key metrics, and visual profiles. Twistiness Score 82 Key Metrics Metric Value Points 1890 Length 30.08 km Elevation Gain 1713 m Curve Density 53.3 curves/km Mean Curvature 234.75 deg/100m Elevation Density 57 m/km Sinuosity 3.49 Switchbacks 89 Turn Angle Density 619 […]
- 1
- 2